Value Proposition

Digital user experience

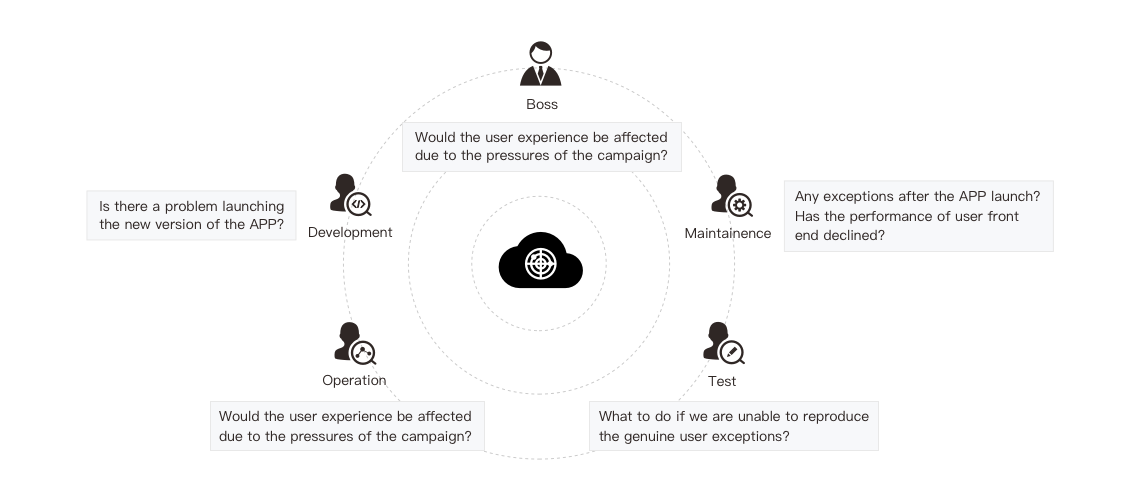
Quantify the real user experience from the rich indicator dimensions such as regional performance, overall response time, request error rate, and crash rate, so that APP optimization can be relied upon to improve user retention.

Code-level positioning

statistically aggregate various abnormal features, record the URL of the request error in the APP, stack information of flashback, CPU/memory consumption of Caton, etc., and reduce the problem positioning time.

Multi-dimensional display

Display APP performance data through composite dimensions such as region, carrier, and access mode, and provide network layer deep drill analysis, such as: DNS, TCP, SSL time, etc.

Specify information retrieval

comprehensively search for abnormal information of the specified device according to multi-dimensional indicators such as device model, device ID, and member ID.

Use Cases

Success Stories

Functionality

  • Fine-optimize HTTP(s)/WEBSOCKET/SOCKET, record time-consuming data such as DNS, TCP, SSL, service response and data reception in network requests, quickly locate time-consuming links, and clarify network and server performance.
  • Statistical network errors, HTTP errors, etc., the number of errors in each domain name, the URL and its error rate statistics, record the details of each error, refine the request to the request header, request parameters, response headers, etc.

  • When a user loads an H5 page in a monitoring application, user experience time, such as page loading time, white screen time, and first screen time can be provided.
  • Record the image of the waterfall loaded on each page, analyze the page loading from the first page element, HTML download time, DOM creation time, resource loading time, rendering time, etc.

  • Aggregate statistics based on operating system type, device model, crash type, etc., showing real-time crash rate and number of affected users
  • Crash analysis captures exception information when an application crashed, recording user behavior tracking and context information before it happened
  • Provide a symbolic solution to fully find the cause of the crash

  • analysing the main thread blocking, hang, infinite loop, etc. caused by the application process itself or indirectly by other processes of ANR problem.
  • Aggregate statistics based on device model, operating system type, and APP version, showing real-time card rate and number of users
  • Restore Caton / ANR field information, including CPU, memory consumption, and all thread and network time-consuming analysis

  • In the massive performance data, accurately and quickly extract the abnormal information of the specified user, quickly retrieve user crashes, custom exceptions, network request errors, ANR and other abnormal user experience abnormal logs.

Tariff and Pricing

Gradient payment according to the number of monthly active devices of APP.

Monthly price from

6,000 /month/APP

Annual price from

72,000 /year/APP

Call us

400-151-8800

Email us

cloud@pingan.com

Online customer service

Instant reply

Technical Support

cloud products